California’s worst fires in State history (based on acreage burned) occurred in 2008, 2017 and 2018, scorching more than 4 million acres collectively. The devastation is larger than the state of Connecticut. According to CalFire Reports:
- 2008 – 1.35 million acres burned
- 2017 – 1.34 million acres burned
- 2019 – 1.59 million acres burned
Aside from damage to the lands, the fires wreaked havoc on the atmosphere by releasing millions of metric tons (MMt) of carbon dioxide (CO2). According to the California Air Resources Board (CARB), the emissions from the fires only caused the release of:
- 45.7 MMt CO2 in 2008
- 36.7 MMt CO2 in 2017
- 45.5 MMt CO2 in 2018
At present, more than 1.6 million acres have burned as a result of California wildfires. The LNU Lightning Complex Fire and the SCU Lightning Complex Fire are already classified as the second and third largest in State history – each have burned more than 370,000 acres as of mid-day August 28. With the peak of the fire season still to come, it is likely California will blow by the CO2 emissions as a result of fires.
If California sought to offset those emissions, how would we do it? What would you need to shut off and for how long? Using CARB’s data from 2017 (which is the latest data publically available), in 2017, California’s total emissions from all sectors were 424.1 MMt CO2e (CO2e—Carbon and Carbon Equivalents) – this is how much carbon it took to move the fifth largest economy in the world.
By sector, the emissions breakdown is as follows:
- Commercial 5% (~21.2 MMt CO2e)
- Electricity (Imports) 6% (~25.4 MMtCO2e)
- Residential 7% (~29.7 MMt CO2e)
- Agriculture 8% (~33.9 MMt CO2e)
- Electricity (In-State) 9% (~38.2 MMt CO2e)
- Industrial 24% (~101.8 MMt CO2e)
- Transportation 41% (~138.9 MMt CO2e)
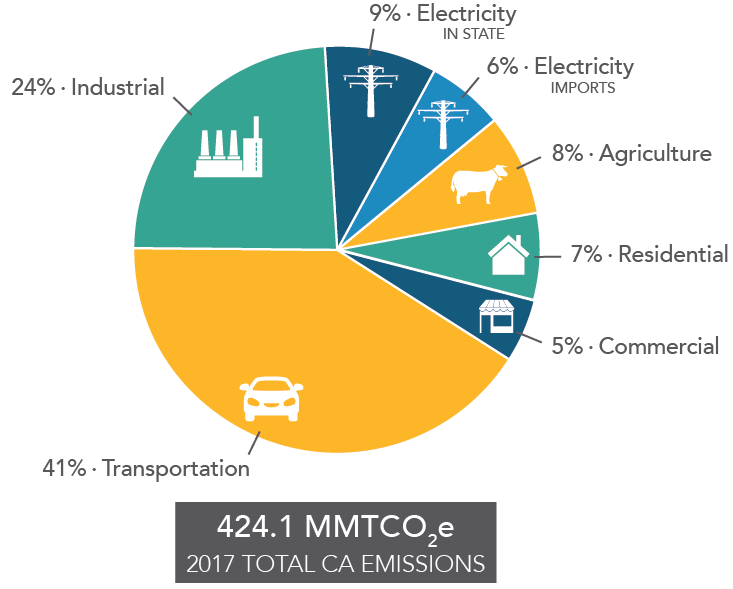
Source: California Air Resources Board, California’s Total Emission for 2017
Of the above, which would Californian’s be willing to give up in order to offset the top three most destructive fires in California history to date (not counting 2020, which has not yet concluded)?
Are California policies really creating the intended benefits we sought to achieve, or is there a better approach? Legislators, regulators, environmentalists and business leaders will undoubtedly debate this very question for years to come.
Note 1: According to CARB records, from 2000-2018, CO2 emissions from just fires totaled 327.4 MMt of CO2.
Note 2: 2017’s annual total of 424.1 MMt CO2e is equivalent to ~35.34 MMt CO2e per month. In order to offset the total emissions form just the fires from 2000-2018, assuming roughly equivalent emissions, California would have to offset – or “shutdown” – that is, produce no emissions at all from any sector for ~280 days.
Note 3: To offset just the transportation sector’s 138.9 MMt CO2e in 2017 would require no transportation of any kind for nearly four months – no vehicular or air traffic of any kind – no deliveries to stores, no deliveries of any kind.
